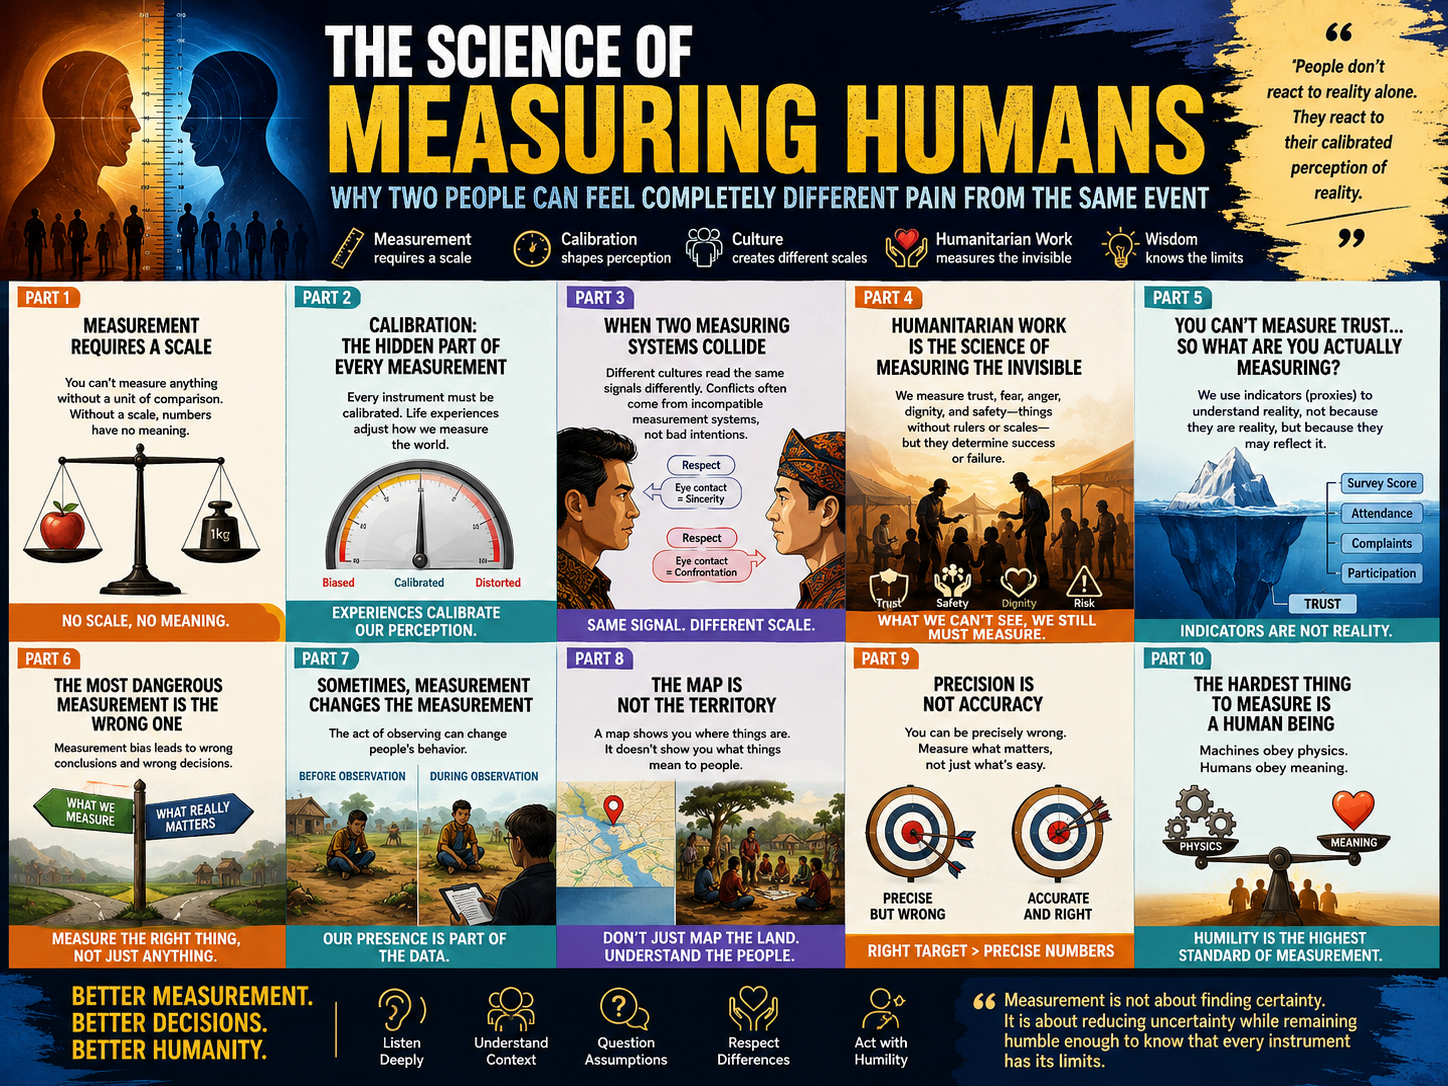
From elementary school to university, we spend years learning how to measure things. Length. Weight. Time. Temperature. Pressure. Speed. But nobody ever explained the most important part: that every human being standing in front of you is running a completely different measuring system — and that most of what we call conflict is really just two instruments disagreeing about the same reality.
This is a ten-part essay about metrology, calibration, cultural collision, humanitarian practice, and the quiet epistemological catastrophe of measuring the wrong thing very precisely. It ends where all measurement eventually ends: at the limits of what a number can hold.
The Ten Parts
- Why Were We Taught Measurement?
- Calibration: The Hidden Part of Every Measurement
- When Two Measuring Systems Collide
- Humanitarian Work Is the Science of Measuring the Invisible
- You Can't Measure Trust — So What Are You Measuring?
- The Most Dangerous Measurement Is the Wrong One
- Sometimes, Measurement Changes the Measurement
- The Map Is Not the Territory
- Precision Is Not Accuracy
- The Hardest Thing to Measure Is a Human Being
Part I — Why Were We Taught Measurement?
From elementary school to university, we spend years learning how to measure things. Length. Weight. Time. Temperature. Pressure. Speed. But have you ever wondered why?
Because without measurement, comparison becomes meaningless. Imagine someone saying: "It's hot today." How hot? 30°C? 86°F? 303.15 K?
Interestingly, all three numbers describe exactly the same temperature. Different numbers. Different scales. The same reality. None of them is "wrong" — they simply use different measurement systems. The same applies to distance. One mile is not one kilometer. One kilogram is not one pound. One liter is not one gallon.
Before we compare numbers, we must first understand the measuring system behind them.
The Theory Behind This
This is not merely a school lesson. It is the foundation of an entire scientific discipline called metrology — the science of measurement. The International Bureau of Weights and Measures defines a measurement result as meaningless without a stated unit and a stated uncertainty.1
Psychology arrived at the same conclusion from a different direction. In 1946, S. S. Stevens published his theory of scales of measurement — nominal, ordinal, interval, and ratio — arguing that the type of scale determines what mathematical operations are even permissible.2 You cannot meaningfully average nominal categories. You cannot claim 40°C is "twice as hot" as 20°C, because Celsius has an arbitrary zero. Stevens' insight was radical: the scale is part of the claim. Strip away the scale, and the claim collapses.
Interactive 1 — The Same Reality, Three Numbers
Drag the slider. Notice that all three readings move together — because they describe one temperature, not three.
Three numbers. Zero disagreement.
Where This Becomes Human
Surprisingly, many of us forget this lesson when dealing with people. We assume everyone measures pain, respect, humiliation, or love using the same internal scale. But humans are not manufactured in the same factory. Each of us has been calibrated by different experiences, cultures, beliefs, memories, personalities, and relationships.
The exact same words can comfort one person and devastate another. The exact same criticism can motivate one employee while causing another to lose confidence for months. The exact same silence can mean respect in one culture and rejection in another. The event is identical. The measurement system is not.
The Question Nobody Asks
Science teaches us to ask: "Which unit are we using?" Maybe human relationships require a similar question: "Whose measurement system am I using?" Just because you wouldn't be hurt doesn't mean someone else shouldn't be. Just because you don't see disrespect doesn't mean everyone measures respect the way you do. Perhaps the biggest mistake we make isn't failing to understand people — it's assuming our own internal scale is universal.
Part II — Calibration: The Hidden Part of Every Measurement
In Part I we established that a number without a scale is meaningless. But there is a second, quieter problem. Even when two people use the same scale, they may still disagree — because their instruments were never calibrated the same way.
Owning a measuring instrument doesn't guarantee accurate measurements. Every scientist knows this. Before collecting data, instruments must first be calibrated. A thermometer off by a few degrees can ruin an experiment. An uncalibrated scale reports the wrong weight. A poorly calibrated GPS places you in the wrong location. The problem isn't the measurement. The problem is the instrument.
The Theory Behind This
In metrology, calibration is the documented comparison of an instrument against a traceable reference standard.3 Notice the word traceable: every calibrated instrument in the world can, in principle, be traced back through an unbroken chain to an international standard. Without traceability, an instrument is just an opinion with a display screen.
The human parallel has a name in psychology: schema theory. Jean Piaget described schemas as mental structures built from experience that organise how new information is interpreted.4 Aaron Beck later built cognitive therapy on the same foundation, showing that emotional distress often originates not in the event itself but in the core beliefs through which the event is filtered.5
Sociology offers a third lens. Pierre Bourdieu's concept of habitus describes the durable dispositions we acquire from our social environment — dispositions that feel like natural instinct but are in fact deeply historical.6 Habitus is calibration: the invisible factory setting installed by class, family, and culture. And Lisa Feldman Barrett's theory of constructed emotion goes further still: emotions are not passively detected but actively constructed by the brain using prior experience as a predictive model.7 Two people receiving identical sensory input can construct genuinely different emotional realities — and both are neurologically real.
Interactive 2 — Calibrate a Human Instrument
Adjust someone's life history, then send the exact same sentence into their instrument. Watch the reading change while the input never does.
People don't react to reality alone. They react to their calibrated perception of reality. Perhaps the question isn't "Why are they overreacting?" but "What experiences calibrated them to measure this differently from me?"
Part III — When Two Measuring Systems Collide
Part II explained why individual instruments drift. But calibration is not only personal — it is collective. Entire cultures calibrate their populations in systematically different directions. And when two such populations meet, the collision is not a clash of intentions. It is a clash of units.
Years ago, I witnessed something fascinating. Two teachers were having a disagreement. One was Batak. The other was Javanese. Neither of them intended to be disrespectful. Yet both felt disrespected.
The Batak teacher maintained direct eye contact throughout the conversation. For him, looking someone in the eyes meant sincerity, confidence, honesty, engagement. The Javanese teacher interpreted the same behavior differently: prolonged eye contact during a disagreement felt confrontational, almost like a challenge. So he lowered his gaze — not from fear, not from dishonesty, but because in his culture lowering one's gaze signals respect and humility.
Then something remarkable happened. The Batak teacher interpreted the lowered gaze as avoidance, perhaps dishonesty. The Javanese teacher interpreted the eye contact as aggression. Neither side changed their behavior — because neither believed they were doing anything wrong. Both were simply measuring respect using different cultural scales.
The Theory Behind This
Edward T. Hall's work on high-context and low-context cultures provides the classic framework.8 In low-context cultures, meaning is carried explicitly in words. In high-context cultures, meaning is carried in relationship, hierarchy, silence, and gesture — the words are only the visible tip. Javanese communication is strongly high-context; the concepts of halus (refined restraint) and rukun (social harmony) documented by Clifford Geertz make indirectness a moral achievement, not an evasion.9
Erving Goffman's face-work theory adds precision: every interaction involves the mutual protection of "face," the positive social value a person claims.10 Brown and Levinson formalised this into politeness theory, distinguishing negative face (the desire not to be imposed upon) from positive face (the desire to be approved of).11 Cultures weight these differently. What protects face in one system threatens it in another.
Then there is the mechanism itself. Fundamental attribution error describes our systematic tendency to explain other people's behaviour through their character while explaining our own through circumstance.12 The Batak teacher does not think "his culture values downcast eyes." He thinks "this man is hiding something." This is what conflict scholars call an attribution spiral, and it is why Johan Galtung insisted peacebuilding must address cultural violence — the layer of legitimising assumptions beneath both direct and structural violence.13
Interactive 3 — The Signal Translator
Pick a gesture. Pick a cultural frame for the receiver. The signal is identical every time — the meaning is not.
Where Conflicts Actually Begin
People often assume conflicts begin with hatred. Many don't. Some begin with a handshake. A silence. A joke. A gesture. A glance. The signal stays the same — the interpretation changes. Once we see this, many conflicts stop looking like battles between good and bad. They start looking like collisions between different ways of measuring the same human interaction.
Part IV — Humanitarian Work Is the Science of Measuring the Invisible
If Part III was about two people, this part is about two hundred thousand. Because the moment cultural measurement mismatch scales up to the level of populations, aid, and survival, the stakes change entirely.
When people hear the word humanitarian, they imagine food distribution, medical aid, emergency shelters, clean water. Those things matter. But before any of them happen, there is another job that matters more: measurement. Not measuring roads. Not measuring buildings. Not measuring rainfall. Measuring people.
How much trust still exists? How much fear is spreading? How much anger is accumulating? How much humiliation has been left unspoken? How close is a community to violence? Unlike temperature or weight, these things have no thermometer, no ruler, no weighing scale. Yet they determine whether an intervention succeeds or fails.
Imagine entering a village after a disaster. Two communities receive exactly the same aid — the same tents, food, medicine. On paper everything is equal. But one community feels respected. The other feels ignored. Why?
The Theory Behind This
Mary Anderson's Do No Harm framework was built precisely on this observation: aid is never neutral, because aid is always interpreted.14 The same distribution can strengthen local capacities for peace or reinforce dividers, depending entirely on how recipients read the intention behind it.
The distinction is captured in the difference between distributive justice (who got what) and procedural justice (whether the process felt fair and respectful). Tom Tyler's research consistently finds that perceptions of procedural fairness predict compliance and trust more strongly than the actual favourability of outcomes.15 People will accept a bad outcome from a fair process more readily than a good outcome from a humiliating one.
Amartya Sen's capability approach pushes further, arguing that development cannot be measured in commodities delivered but only in the real freedoms people gain.16 Two identical tents do not confer identical capability. And beneath all of it sits Evelin Lindner's work on humiliation dynamics: humiliation, she argues, is the most underestimated force in human conflict — an emotion that can convert gratitude into grievance in a single interaction.17
Why This Matters Most for Indigenous and Traditional Communities
There is one domain where the measurement problem becomes existential rather than merely technical: Intangible Cultural Heritage (ICH). UNESCO's 2003 Convention defines ICH as "the practices, representations, expressions, knowledge, skills — as well as the instruments, objects, artefacts and cultural spaces associated therewith — that communities, groups and, in some cases, individuals recognize as part of their cultural heritage."18 Oral traditions. Performing arts. Social practices, rituals, festive events. Knowledge and practices concerning nature and the universe. Traditional craftsmanship.
Notice the definition's most radical clause: that communities recognize as part of their cultural heritage. The Convention hands the authority of definition to the community itself, not to the expert, the ministry, or the visiting consultant. This was a deliberate epistemological correction — and it is the single most important sentence in the entire heritage field.
For Indigenous peoples, ICH is not decoration. It is infrastructure. Consider what is actually encoded inside a body of traditional knowledge:
- Survival technology. Oral tradition can carry disaster knowledge across generations more durably than any institution. The Smong tradition of Simeulue, Aceh — transmitted through story and song after the 1907 tsunami, instructing people to move to high ground when the sea withdraws following an earthquake — is a widely discussed example of intangible heritage functioning as living safety knowledge. The mechanism is the point: the instruction survived because it was sung and retold, not because it was archived.
- Ecological governance. Sasi in Maluku, awig-awig in Lombok, lubuk larangan in Sumatra, subak in Bali — these are functioning common-pool resource institutions, not folklore. Elinor Ostrom's Nobel-winning fieldwork demonstrated that such systems frequently outperform both state regulation and privatisation at preventing resource collapse.20
- Legal standing. In many jurisdictions, demonstrable continuity of customary practice is the evidentiary basis for land rights. When the practice dies, the legal claim weakens. ICH loss is often the precursor to dispossession, not merely its symptom.
- Mental health and identity. Research on cultural continuity has found significant protective associations between community-level cultural continuity factors and youth suicide rates in Indigenous communities — the strongest predictor was not income or services but whether the community retained control over its own cultural institutions.21
- Biodiversity. The IPBES Global Assessment concluded that lands managed by Indigenous peoples and local communities are declining in ecological condition far more slowly than other lands, and that this outcome is tied directly to the persistence of traditional management knowledge.22
Now connect this back to measurement. Language extinction rates are estimated at roughly one language lost every two weeks — and when a language dies, the taxonomies, seasonal calendars, medicinal knowledge, and navigational systems encoded exclusively in it die with it, frequently before any outsider ever recorded that they existed. We do not know what we are losing, because we never had an instrument capable of detecting it.
This is the sharpest possible illustration of the essay's whole argument. Standard development metrics — GDP, literacy rates, road kilometres, school enrolment — register a community that abandons its language and relocates to a town as developed. The same event registers, in ICH terms, as catastrophic institutional collapse. Both measurements are internally valid. They are measuring different realities. And the community bears the consequences of whichever instrument the policymaker happened to be holding.
Interactive 4 — Intangible Cultural Heritage Vitality Meter
Adjust the conditions in a community. The meter estimates transmission vitality — the only variable that actually determines whether a tradition survives to the next generation.
Illustrative model only — conceptually informed by UNESCO's nine safeguarding criteria and the Language Vitality & Endangerment framework, not a validated diagnostic instrument.
Why Communities Must Hold the Instrument
This is why the 2003 Convention insists on community participation as a binding requirement rather than a courtesy. An outsider can count performances, film ceremonies, and archive recordings — and produce a beautiful dataset describing something that is already dead. Only the community can tell you whether the practice still means anything. Documentation without transmission is taxidermy. It preserves the shape and loses the life.
The humanitarian sector has formally recognised this. The Core Humanitarian Standard makes participation, complaints mechanisms, and respect for dignity binding commitments — not soft extras.23 Because humanitarian work is not only about what is delivered. It is also about how people measure what they receive. One community may see assistance as solidarity. Another as charity. A third as political favoritism. The supplies are identical. The measurements are not.
People do not respond to reality alone. They respond to the meaning they measure from reality. And unless we learn how people measure that meaning, we may solve the wrong problem while believing we solved the right one.
Part V — You Can't Measure Trust, So What Are You Actually Measuring?
Part IV argued that we must measure the invisible. This part asks the uncomfortable follow-up: can we? And if we cannot measure trust directly, what exactly are all those dashboards measuring instead?
One of the most quoted principles in management is: "You can't manage what you can't measure." It sounds simple — until you ask a difficult question. Can you measure trust? Can you place dignity on a weighing scale? Can you calculate humiliation? Of course not. Yet these invisible things determine the success or failure of projects, negotiations, missions, and relationships. So what do professionals do? They measure indicators — not because indicators are trust, but because indicators may reflect trust.
The Theory Behind This
First, a correction that matters. The phrase "you can't manage what you can't measure" is almost universally attributed to W. Edwards Deming — yet Deming's own writing points in close to the opposite direction. In Out of the Crisis he warned against "management by use of visible figures only," arguing that the most important figures needed to run an organisation are unknown and unknowable.24 The most-quoted principle in management rests on a misattribution to a man who spent his career cautioning against it.
What we actually rely on is construct validity, formalised by Cronbach and Meehl in 1955.25 Trust is a latent construct: unobservable, but inferable from observable indicators. The entire question of measurement quality becomes: does this indicator actually track the construct, or does it track something else that merely correlates with it in easy conditions?
Donald Campbell's Law states it bluntly: the more any quantitative social indicator is used for social decision-making, the more apt it will be to be corrupted.26 Charles Goodhart's version is shorter: when a measure becomes a target, it ceases to be a good measure.27 Jerry Muller's The Tyranny of Metrics documents the institutional carnage that follows.28
Interactive 5 — What Does This Indicator Actually Mean?
Each of these looks like unambiguous good news on a dashboard. Click one to reveal the competing explanations that the same number is equally consistent with.
The Instrument Is Not the Thing
A thermometer does not create temperature; it estimates it. A speedometer does not create speed; it reports it. Survey scores, attendance rates, and engagement numbers are not reality — they are instruments attempting to describe reality. Good professionals never worship the numbers. They ask a better question: "What might these numbers be missing?"
Part VI — The Most Dangerous Measurement Is the Wrong One
Part V showed that indicators are proxies. This part shows what happens when the proxy itself is broken — when the instrument, not the population, is the source of the error.
People often say, "The data doesn't lie." I disagree. Data doesn't lie. But measurements can. Every measurement contains assumptions. Every instrument has limitations. Every question shapes the answer it receives.
Imagine asking a community: "Are you satisfied with our program?" Suppose 95% answer yes. Excellent result? Maybe. Or maybe people fear offending local leaders or the government. Maybe they worry future assistance will stop. Maybe saying "no" is considered impolite in their culture. The number is real. The interpretation may not be.
The Theory Behind This
Survey methodology has names for every failure mode in that paragraph. Social desirability bias — respondents answer as they believe they should.29 Acquiescence bias — the tendency to agree with whatever is asked, strongest among respondents of lower status relative to the interviewer.30 Courtesy bias — a well-documented cross-cultural phenomenon where respondents inflate positive answers to avoid embarrassing a guest. And power asymmetry: when the person asking about satisfaction also controls next month's food distribution, the survey is not measuring satisfaction. It is measuring dependency.
Robert Chambers built his critique of development practice on this, arguing that professional measurement systematically privileges what is countable, visible, and convenient for the outsider — producing the reality of "we" rather than the reality of "they."31 James C. Scott supplies the other half: silence and public compliance are often strategic, not sincere. What Scott calls the "hidden transcript" is invisible by design.32 And Noelle-Neumann's spiral of silence explains the group mechanism: individuals who perceive their view as a minority position progressively withhold it, which makes it appear even smaller, which increases the pressure to withhold.33 Unanimity in a meeting may be evidence of suppression, not agreement.
The same happens in everyday life. A quiet employee is labeled "unmotivated." A silent child in a mangrove school is labeled "shy." A patient who doesn't complain is assumed to be fine. A community that doesn't protest is considered satisfied. But silence has many meanings: respect, fear, trauma, exhaustion, hopelessness. Without context, we risk measuring the wrong thing — and once we measure the wrong thing, we often solve the wrong problem.
The greatest danger isn't making decisions with no data. It's making confident decisions based on misleading measurements. The smartest person in the room isn't the one who collects the most data — it's the one who understands what the data cannot see.
Part VII — Sometimes, Measurement Changes the Measurement
Part VI dealt with instruments that distort. This part deals with something stranger: instruments that alter the thing they touch. Because unlike a rock or a river, the subjects of human measurement can see us coming.
A person may behave naturally — until they realize they're being watched. Suddenly they smile more. Speak differently. Become more careful. Or remain unusually quiet. Did the person change, or did the observation change the behavior?
The Theory Behind This
The classic reference is the Hawthorne effect, named after the Western Electric studies of the 1920s–30s, where worker productivity appeared to improve in response to being studied rather than to any specific change in conditions.34 It is worth noting that later reanalyses have contested the original interpretation35 — but the underlying phenomenon, reactivity, is robust and independently established.
Campbell and Stanley catalogued reactivity as a formal threat to internal validity.36 Martin Orne's work on demand characteristics demonstrated that subjects actively construct hypotheses about what the researcher wants and then perform accordingly.37 Robert Rosenthal's observer-expectancy effect showed that the researcher's own expectations leak into the interaction and shape the result — the reason double-blind protocols exist.38
In social theory, Anthony Giddens named the broader phenomenon double hermeneutics: unlike atoms, the objects of social science can read the theories written about them and modify their behaviour accordingly.39 Ian Hacking's looping effect traces how classification itself reshapes the classified.40 Anthropology's response was reflexivity: the acknowledgement, formalised in Writing Culture, that the observer is always inside the frame. There is no view from nowhere.41
Interactive 6 — The Observer Effect
Toggle the observer on and off. The community's underlying reality never changes — only what it displays.
The Instrument That Can Be Seen
In humanitarian work, our arrival changes conversations. In conflict resolution, our presence changes emotions. In cultural preservation, our questions may change the stories people choose to tell. Unlike rulers or thermometers, people can see the instrument measuring them. And once they do, the measurement itself begins to change.
Part VIII — The Map Is Not the Territory
Parts V through VII dismantled our instruments one by one. This part names the underlying error they all share — the quiet slide from representation to reality.
A map can tell you where a village is. It cannot tell you whether the village trusts outsiders. A satellite image can show forest cover. It cannot show fear. GIS can identify where conflicts occurred. It cannot explain why they started. A dashboard can tell you how many people attended a meeting. It cannot tell you how many stayed silent because they were afraid to disagree.
Coordinates are measurable; human dignity isn't. Elevation is measurable; humiliation isn't. Rainfall is measurable; resentment isn't.
The Theory Behind This
The phrase belongs to Alfred Korzybski, who wrote in 1933 that a map is not the territory it represents, but, if correct, has a similar structure to the territory, which accounts for its usefulness.42 Gregory Bateson later sharpened it into a theory of information: what crosses from territory to map is difference — and everything that does not constitute a difference the mapmaker chose to record simply vanishes.43
Geography has its own hard version. The Modifiable Areal Unit Problem demonstrates that statistical results change depending on how you draw the boundaries — the same underlying population can yield opposite conclusions under different aggregation schemes.44 The ecological fallacy shows that inferences about individuals drawn from group-level data can be not merely imprecise but reversed.45
James C. Scott's Seeing Like a State is the political indictment. States require legibility: they must simplify complex local reality into standardised, countable, mappable units in order to govern it.46 The simplification is the point. But the local knowledge erased in the process — what Scott calls mêtis, practical situated wisdom — is frequently the knowledge on which the whole system depended. Foucault adds the final turn: deciding what counts as a countable unit is itself an exercise of power.47 Whoever defines the categories has already shaped the outcome.
A Note to My Friends in Geography
Don't just measure the land — measure the people living on it. Don't only map rivers — map relationships. Don't only classify ecosystems — understand communities. A village is more than a polygon. A community is more than a dataset. A culture is more than a point on a map. Humanitarian work begins the moment we realize people are not layers in a GIS project. They are the reason the map exists at all.
Part IX — Precision Is Not Accuracy
Part VIII warned that maps omit. This part warns about something more seductive: maps that are exquisitely detailed and pointed at the wrong place.
Imagine an archer shooting arrows. If all the arrows land close together, the shots are precise. But if they all land far from the bullseye, they are not accurate. Consistency does not guarantee correctness.
Interactive 7 — Precision vs. Accuracy Target
Adjust bias (systematic error) and spread (random error). Watch how a tight cluster can still be completely wrong.
More data reduces spread. It never reduces bias.
The Theory Behind This
Metrology defines these terms strictly. Precision describes the closeness of repeated measurements to one another — random error. Accuracy (or trueness) describes closeness to the actual value — systematic error, or bias. ISO 5725 codifies the distinction.48 An instrument can be perfectly precise and consistently wrong; averaging more measurements reduces random error but never touches bias.
The deepest version of this problem is not statistical but epistemological. It is what Howard Raiffa named the Type III error: solving the wrong problem precisely.49 Ackoff and Mitroff both wrote extensively on this, with Ackoff arguing that managers fail far more often from correctly solving misformulated problems than from incorrectly solving well-formulated ones.50
The Stiglitz–Sen–Fitoussi critique of GDP is the canonical policy example: a measure of extraordinary precision, computed to decimal places, which nonetheless says little about whether people's lives are going well.51 This is why the Human Development Index was constructed — not because GDP was imprecise, but because it was pointed at the wrong target. Taleb adds the risk dimension: excessive confidence in precise numbers is itself a source of fragility, because precision creates the illusion that uncertainty has been eliminated when it has only been hidden behind decimal points.52
We build dashboards with thousands of data points. 98.74%. 12,541 beneficiaries. 3,276 hectares. 97.8% satisfaction. The numbers are impressive. But measuring the wrong variable with extraordinary precision is still measuring the wrong variable. Ninety-five percent attended the workshop — but did they understand the message? Did they trust the facilitator? Did behavior change six months later? Attendance was measured precisely. Impact wasn't.
Good professionals ask two questions. First: "How accurate is this measurement?" But before that, an even more important one: "Are we measuring what actually matters?" Because a beautifully measured mistake is still a mistake.
Part X — The Hardest Thing to Measure Is a Human Being
Nine parts of critique now converge — not into a rejection of measurement, but into an argument for taking it far more seriously than a dashboard ever could.
Measurement was never just about numbers. It was never just about rulers, thermometers, or satellites. Measurement is about reducing uncertainty. That is why we invented meters, kilograms, Kelvin, GPS, microscopes, statistical models, artificial intelligence. We keep building better instruments because reality is too complex to understand with our eyes alone.
Yet despite all our technological progress, the most difficult thing to measure has remained the same: a human being. How do you measure dignity? Grief? Trust? Hope? The moment a community decides to forgive — or decides to fight? There is no universal unit. No international standard. No perfect instrument.
The Theory Behind This
Douglas Hubbard's central claim in How to Measure Anything is that measurement is not the production of certainty but the reduction of uncertainty — and that by this definition almost anything can be measured, provided we abandon the demand for exactness.53 This reframing rescues measurement from the perfectionism that makes practitioners give up on the intangible entirely.
But there is a boundary. Wilhelm Dilthey's distinction between Erklären (explanation, the mode of the natural sciences) and Verstehen (understanding, the mode of the human sciences) survives because it names something real.54 Max Weber built sociology on Verstehen.55 Clifford Geertz built anthropology's thick description on it — the argument that a wink is not a blink plus muscle movement, and that no amount of physiological precision will ever recover the meaning.56
Martha Nussbaum's capabilities list represents the most serious attempt to make dignity operational without reducing it — ten central capabilities that resist collapse into a single index precisely because they are incommensurable.57 Elinor Ostrom's fieldwork demonstrated the empirical payoff of this humility: she found governance solutions invisible to standard models because she measured what communities actually did rather than what theory predicted they must.20 And Sen's warning stands as the discipline's conscience: it is better to be vaguely right than precisely wrong.
Perhaps that is why working with people is so much harder than working with machines. Machines obey physics. Humans obey meaning. And meaning changes from one person, one family, one culture, and one generation to another.
The lesson isn't that measurement is unimportant. The lesson is exactly the opposite: measurement is so important that we must constantly ask whether we are measuring the right reality. Because every decision, every policy, every humanitarian intervention, every negotiation, every relationship begins with a measurement — sometimes explicit, sometimes unconscious.
The Final Question
So perhaps the most important question is no longer, "How do we measure better?" but rather, "Have we chosen the right thing to measure in the first place?" Because once we answer that question, we don't just become better scientists. We become better professionals. Better leaders. And perhaps — better human beings.
Every instrument we have ever built was an attempt to see more clearly. The last and hardest instrument is the willingness to admit that the person in front of us is measuring the same world on a scale we have never read.
Key Sources
1 BIPM. The International System of Units (SI Brochure), 9th ed. — https://www.bipm.org/documents/20126/41483022/SI-Brochure-9-EN.pdf; see also JCGM, International Vocabulary of Metrology (VIM) — https://www.bipm.org/documents/20126/2071204/JCGM_200_2012.pdf
2 Stevens, S. S. (1946). On the Theory of Scales of Measurement. Science, 103(2684), 677–680 — https://www.science.org/doi/10.1126/science.103.2684.677
3 ISO/IEC 17025:2017, General requirements for the competence of testing and calibration laboratories — https://www.iso.org/standard/66912.html
4 Piaget, J. (1952). The Origins of Intelligence in Children — https://archive.org/details/originsofintelli017921mbp
5 Beck, A. T. et al. (1979). Cognitive Therapy of Depression — https://www.guilford.com/books/Cognitive-Therapy-of-Depression/Beck-Rush-Shaw-Emery/9780898629194
6 Bourdieu, P. (1990). The Logic of Practice — https://www.sup.org/books/title/?id=2984
7 Barrett, L. F. (2017). The theory of constructed emotion. SCAN, 12(1), 1–23 — https://academic.oup.com/scan/article/12/1/1/2823712
8 Hall, E. T. (1976). Beyond Culture — https://archive.org/details/beyondculture0000hall
9 Geertz, C. (1960). The Religion of Java — https://press.uchicago.edu/ucp/books/book/chicago/R/bo3623512.html
10 Goffman, E. (1955). On Face-Work. Psychiatry, 18(3), 213–231 — https://www.tandfonline.com/doi/abs/10.1080/00332747.1955.11023008
11 Brown, P. & Levinson, S. (1987). Politeness: Some Universals in Language Usage — https://www.cambridge.org/core/books/politeness
12 Ross, L. (1977). The Intuitive Psychologist and His Shortcomings. Advances in Experimental Social Psychology, 10, 173–220 — https://www.sciencedirect.com/science/article/abs/pii/S0065260108603573
13 Galtung, J. (1990). Cultural Violence. Journal of Peace Research, 27(3), 291–305 — https://journals.sagepub.com/doi/10.1177/0022343390027003005
14 Anderson, M. B. (1999). Do No Harm: How Aid Can Support Peace — Or War — https://www.rienner.com/title/Do_No_Harm_How_Aid_Can_Support_Peace_Or_War
15 Tyler, T. R. (2006). Why People Obey the Law — https://press.princeton.edu/books/paperback/9780691126739/why-people-obey-the-law
16 Sen, A. (1999). Development as Freedom — https://global.oup.com/academic/product/development-as-freedom-9780192893307
17 Lindner, E. (2006). Making Enemies: Humiliation and International Conflict — https://www.humiliationstudies.org/documents/evelin/MakingEnemiesFlyer.pdf
23 CHS Alliance. Core Humanitarian Standard on Quality and Accountability — https://corehumanitarianstandard.org/files/files/Core Humanitarian Standard - English.pdf; Sphere Association (2018). The Sphere Handbook — https://spherestandards.org/wp-content/uploads/Sphere-Handbook-2018-EN.pdf
18 UNESCO (2003). Convention for the Safeguarding of the Intangible Cultural Heritage — https://ich.unesco.org/doc/src/2003_Convention_Basic_Texts-_2020_version-EN.pdf
21 Chandler, M. J. & Lalonde, C. (1998). Cultural Continuity as a Hedge against Suicide in Canada's First Nations. Transcultural Psychiatry, 35(2), 191–219 — https://journals.sagepub.com/doi/10.1177/136346159803500202
22 IPBES (2019). Global Assessment Report on Biodiversity and Ecosystem Services — https://www.ipbes.net/global-assessment; see also UNESCO (2003), Language Vitality and Endangerment — https://unesdoc.unesco.org/ark:/48223/pf0000183699
24 Deming, W. E. (1993). The New Economics for Industry, Government, Education — https://mitpress.mit.edu/9780262541169/the-new-economics-for-industry-government-education/
25 Cronbach, L. J. & Meehl, P. E. (1955). Construct Validity in Psychological Tests. Psychological Bulletin, 52(4), 281–302 — https://psychclassics.yorku.ca/Cronbach/construct.htm
26 Campbell, D. T. (1979). Assessing the impact of planned social change. Evaluation and Program Planning, 2(1), 67–90 — https://www.sciencedirect.com/science/article/abs/pii/0149718979900482
27 Goodhart, C. (1975). Problems of Monetary Management: The U.K. Experience — https://link.springer.com/chapter/10.1007/978-1-349-02321-0_4
28 Muller, J. Z. (2018). The Tyranny of Metrics — https://press.princeton.edu/books/hardcover/9780691174952/the-tyranny-of-metrics
29 Crowne, D. P. & Marlowe, D. (1960). A new scale of social desirability. Journal of Consulting Psychology, 24(4), 349–354 — https://psycnet.apa.org/record/1961-04164-001
30 Groves, R. M. et al. (2009). Survey Methodology, 2nd ed. — https://www.wiley.com/en-us/Survey+Methodology,+2nd+Edition-p-9780470465462
31 Chambers, R. (1997). Whose Reality Counts? Putting the First Last — https://www.developmentbookshelf.com/doi/book/10.3362/9781780440453
32 Scott, J. C. (1985). Weapons of the Weak — https://yalebooks.yale.edu/book/9780300036411/weapons-of-the-weak/
33 Noelle-Neumann, E. (1974). The Spiral of Silence. Journal of Communication, 24(2), 43–51 — https://academic.oup.com/joc/article-abstract/24/2/43/4553955
34 Roethlisberger, F. J. & Dickson, W. J. (1939). Management and the Worker — https://www.hup.harvard.edu/catalog.php?isbn=9780674546769
35 Levitt, S. D. & List, J. A. (2011). Was There Really a Hawthorne Effect at the Hawthorne Plant? AEJ: Applied Economics, 3(1), 224–238 — https://www.aeaweb.org/articles?id=10.1257/app.3.1.224
36 Campbell, D. T. & Stanley, J. C. (1963). Experimental and Quasi-Experimental Designs for Research — https://www.sfu.ca/~palys/Campbell&Stanley-1959-Exptl&QuasiExptlDesignsForResearch.pdf
37 Orne, M. T. (1962). On the social psychology of the psychological experiment. American Psychologist, 17(11), 776–783 — https://psycnet.apa.org/record/1964-01678-001
38 Rosenthal, R. & Jacobson, L. (1968). Pygmalion in the Classroom — https://journals.sagepub.com/doi/10.1177/001698626801200420
39 Giddens, A. (1984). The Constitution of Society — https://www.ucpress.edu/book/9780520057289/the-constitution-of-society
40 Hacking, I. (1995). The Looping Effects of Human Kinds — https://global.oup.com/academic/product/causal-cognition-9780198524021
41 Clifford, J. & Marcus, G. (1986). Writing Culture — https://www.ucpress.edu/book/9780520266025/writing-culture
42 Korzybski, A. (1933). Science and Sanity — https://archive.org/details/sciencesanityint00korz
43 Bateson, G. (1972). Steps to an Ecology of Mind — https://press.uchicago.edu/ucp/books/book/chicago/S/bo3620295.html
44 Openshaw, S. (1984). The Modifiable Areal Unit Problem — https://www.qmrg.org.uk/files/2008/11/38-maup-openshaw.pdf
45 Robinson, W. S. (1950). Ecological Correlations and the Behavior of Individuals. American Sociological Review, 15(3), 351–357 — https://www.jstor.org/stable/2087176
46 Scott, J. C. (1998). Seeing Like a State — https://yalebooks.yale.edu/book/9780300078152/seeing-like-a-state/
47 Foucault, M. (1977). Discipline and Punish — https://archive.org/details/disciplinepunish0000fouc; Harley, J. B. (1989). Deconstructing the Map. Cartographica, 26(2), 1–20 — https://utpjournals.press/doi/10.3138/E635-7827-1757-9T53
48 ISO 5725-1:1994, Accuracy (trueness and precision) of measurement methods and results — https://www.iso.org/standard/11833.html; JCGM 100:2008, Guide to the Expression of Uncertainty in Measurement (GUM) — https://www.bipm.org/documents/20126/2071204/JCGM_100_2008_E.pdf
49 Raiffa, H. (1968). Decision Analysis — https://archive.org/details/decisionanalysis0000raif
50 Mitroff, I. & Featheringham, T. (1974). On Systemic Problem Solving and the Error of the Third Kind. Behavioral Science, 19(6), 383–393 — https://onlinelibrary.wiley.com/doi/10.1002/bs.3830190605
51 Stiglitz, J., Sen, A. & Fitoussi, J.-P. (2009). Report by the Commission on the Measurement of Economic Performance and Social Progress — https://ec.europa.eu/eurostat/documents/8131721/8131772/Stiglitz-Sen-Fitoussi-Commission-report.pdf
52 Taleb, N. N. (2007). The Black Swan — https://www.penguinrandomhouse.com/books/176226/the-black-swan-second-edition-by-nassim-nicholas-taleb/
53 Hubbard, D. W. (2014). How to Measure Anything, 3rd ed. — https://www.wiley.com/en-us/How+to+Measure+Anything-p-9781118539279
54 Dilthey, W. (1883/1989). Introduction to the Human Sciences — https://press.princeton.edu/books/paperback/9780691020747/introduction-to-the-human-sciences
55 Weber, M. (1922/1978). Economy and Society — https://www.ucpress.edu/book/9780520280021/economy-and-society
56 Geertz, C. (1973). Thick Description, in The Interpretation of Cultures — https://web.mit.edu/allanmc/www/geertz.pdf
57 Nussbaum, M. (2011). Creating Capabilities — https://www.hup.harvard.edu/catalog.php?isbn=9780674072350
20 Ostrom, E. (1990). Governing the Commons — https://www.cambridge.org/core/books/governing-the-commons/A8BB63BC4A1433A50A3FB92EDBBB97D5
Note on links: publisher landing pages (Cambridge, Wiley, ISO, UCP) occasionally change structure over time; DOI and archive.org links are the most stable. The interactive models in this essay are illustrative teaching devices, not validated diagnostic instruments.