STRATEGIC FORESIGHT PLATFORM

Detect the Future. Navigate Uncertainty.

A web-based Single-Page Application designed to assist analysts, strategic planners, and innovators in detecting signals of change before they become mainstream trends.

Horizon Scan Dashboard Preview

Horizon Scanning & Strategic Foresight

From Military Radar to Anticipatory Governance and Corporate Strategy

Horizon scanning origins: early radar systems used in military foresight and strategic intelligence

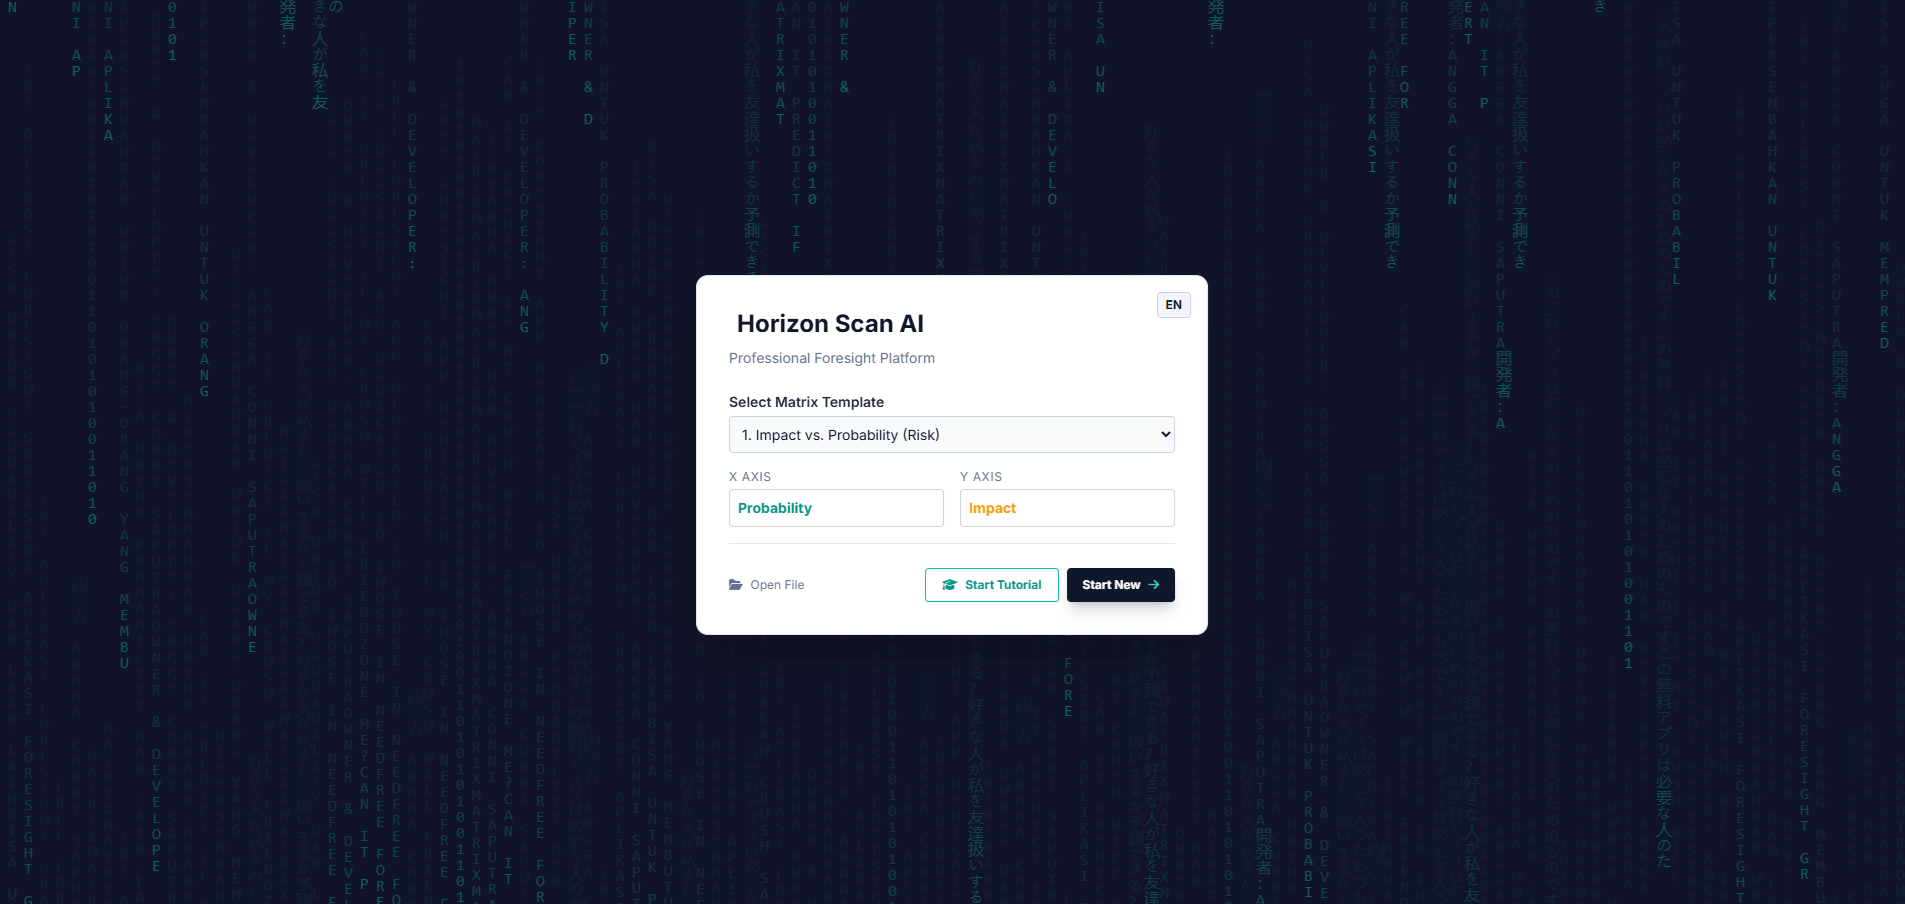
What is Horizon Scanning in Foresight?

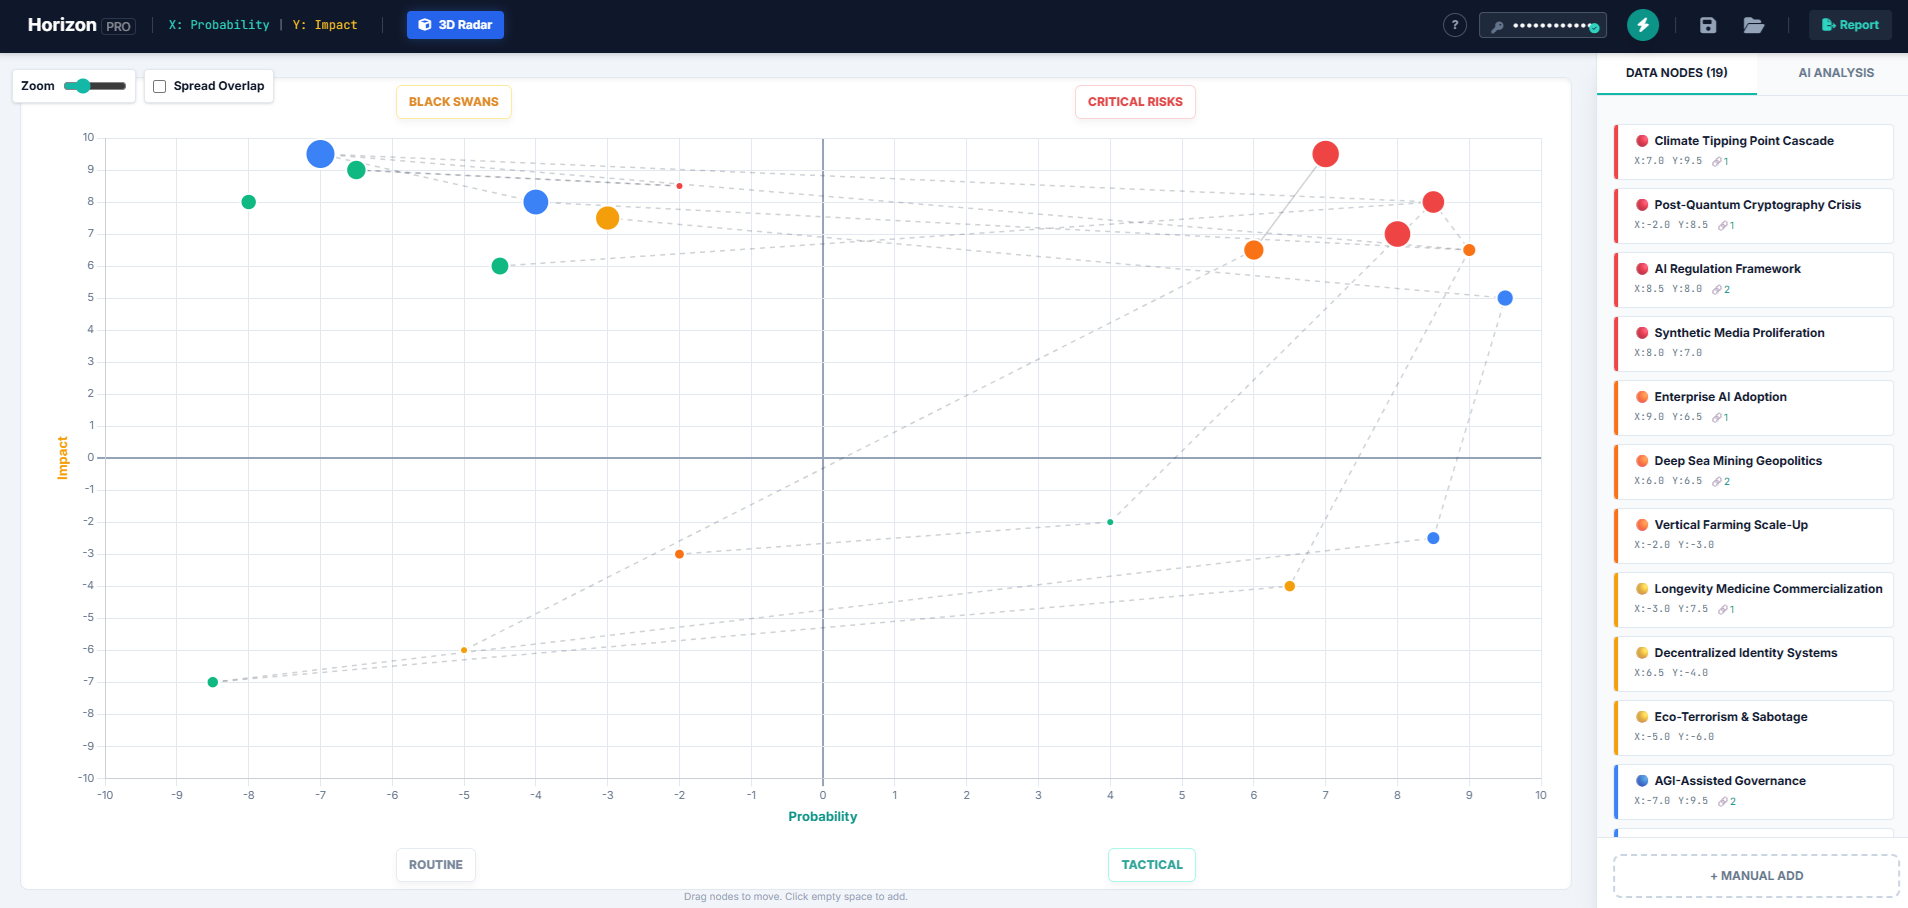
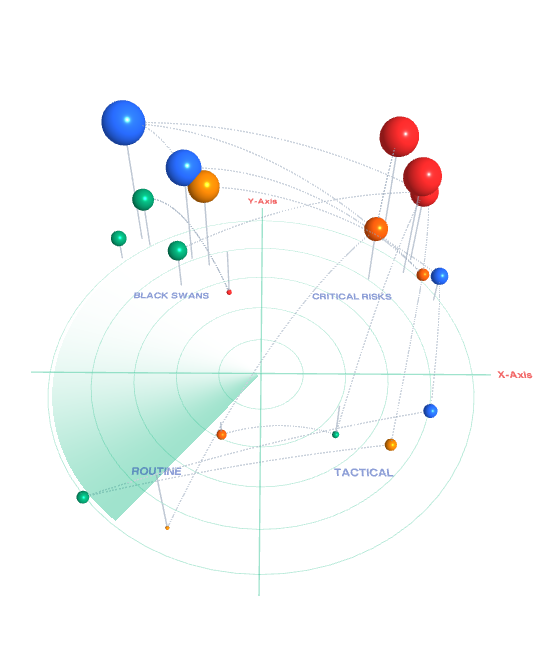
Horizon scanning is a core methodology in strategic foresight used by governments, corporations, and global institutions to identify early signals of change before they become major disruptions.

Before building long-term strategy, leading organizations conduct horizon scanning to map uncertainty, detect emerging trends, and anticipate systemic risks. In the field of foresight and anticipatory governance, this process enables decision-makers to move from reactive planning to proactive strategy.

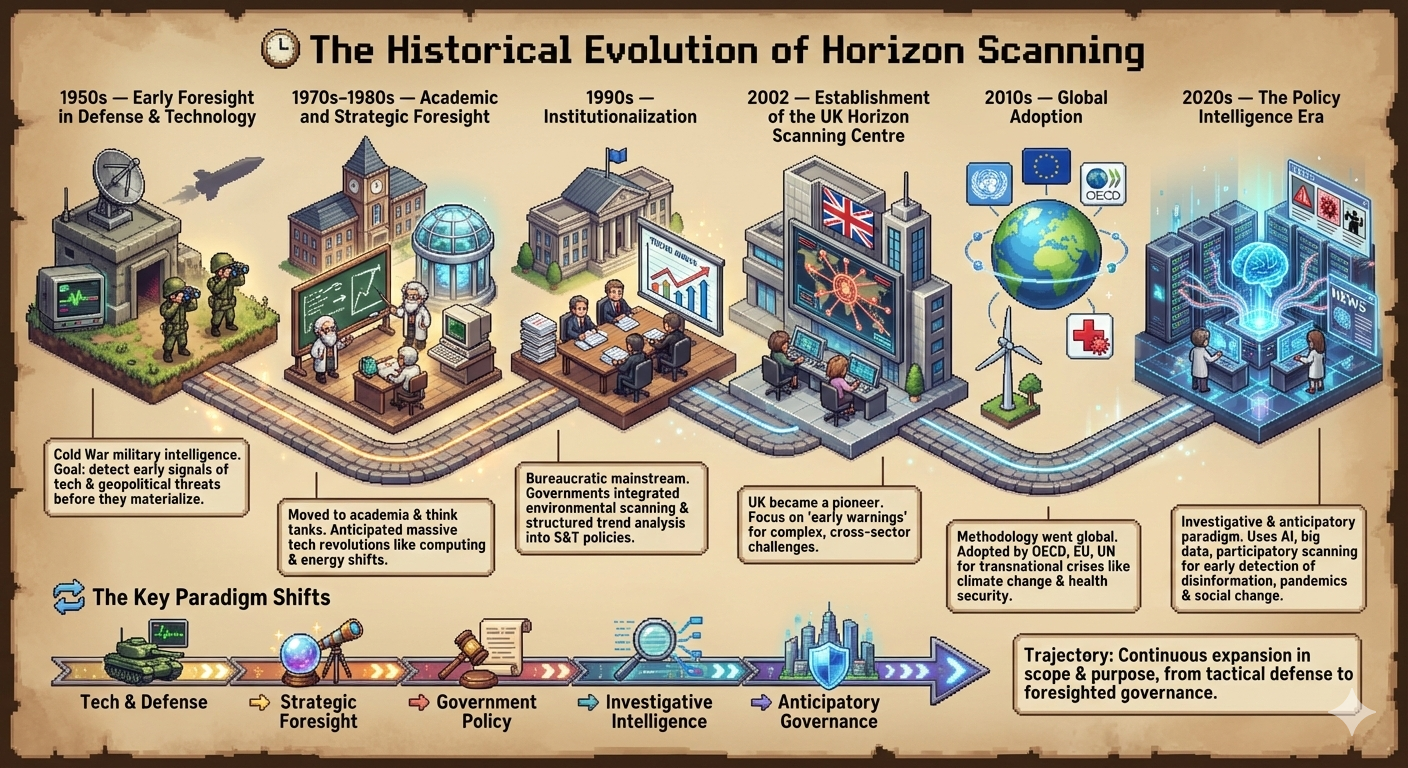
The Historical Evolution

From tactical defense to anticipatory governance.

1950s

Cold War & Early Foresight

Strategic foresight was formalized during the Cold War. Institutions like the RAND Corporation developed methods to anticipate technological and geopolitical threats before they materialized.

1970s–1980s

Academic & Corporate Foresight

Pioneers like Herman Kahn structured scenario planning. It moved to corporate strategy when Royal Dutch Shell successfully applied environmental scanning to anticipate global oil crises.

1990s

Institutionalization

Foresight entered the bureaucratic mainstream. Governments formally integrated environmental scanning and structured trend analysis into their Science & Technology (S&T) policies.

2002

UK Horizon Scanning Centre

The UK became a global pioneer by establishing a dedicated centre, embedding foresight into policymaking to provide 'early warnings' for complex, cross-sector challenges.

2010s

Global Adoption

The methodology went truly global. Organizations like the OECD, EU, and UN adopted horizon scanning to anticipate transnational crises like climate change and health security.

2020s

The Policy Intelligence Era

An investigative & anticipatory paradigm. Integrating AI and big data to transform horizon scanning into an adaptive system for detecting disinformation and rapid social change.

Trajectory: Continuous expansion in scope & purpose, evolving from tactical defense ➔ strategic foresight ➔ government policy ➔ investigative intelligence ➔ anticipatory governance.

Challenges in Modern Horizon Scanning

Despite advances in data and AI, many foresight and horizon scanning practices remain inefficient and fragmented:

Manual & Static Tools

Traditional foresight relies on sticky notes, spreadsheets, and workshops that quickly become outdated in fast-changing environments.

Bias in Signal Interpretation

Cognitive biases such as groupthink and confirmation bias often distort how weak signals are interpreted.

Disconnected AI Tools

Many AI tools are deployed as generic assistants, lacking integration with structured foresight and horizon scanning frameworks.

Effective foresight is not just about collecting signals—it requires structured synthesis and interpretation.
Horizon Scan AI is designed to transform raw signals into actionable strategic insight.

This foresight methodology is widely used by global institutions

Core Capabilities

Fusing Matrix Visualisation with AI

Transform scattered data points into actionable strategic insights instantly.

Dynamic Scanning Matrix

An interactive visual grid that serves as your strategic canvas. Map signals on customizable axes and freely drag-and-drop nodes in real-time.

AI-Powered Analysis

Seamlessly integrated with Google's Gemini API. The system automatically scans your matrix to detect hidden patterns and generate strategic reports.

Signal Classification

A robust categorization system organizing trends into: Emerging, Watchlist, Escalating, Critical, and Structural with color-coded visual cues.

Portable JSON Files

Your entire project state is saved as a lightweight, standalone JSON file. 100% private, easy sharing, with no complex database setup required.

Tutorial Mode

An immersive, built-in interactive guide that walks new users through the methodology, explaining the significance of each quadrant.

Spread Overlap

Applies a visual "jitter" slightly scattering clustered dots sharing exact coordinates so you can interact with nodes that would otherwise be hidden.

How to Use HorizonScan AI

Master the platform's core workflow in just a few clicks.

Horizon Scan App Interface

Data Nodes (Big/Small Nodes are depends on Z Axis)

  • 1
    Open the App: Simply click Open Tool in the header.
  • 2
    Initial Setup: Upon launching, select a Matrix Template that aligns with your analysis goal (e.g., Impact vs. Probability for risk, Novelty vs. Maturity for innovation). You can explicitly rename the X and Y axes to match your specific methodology. Note that the platform also natively supports a Z-Axis (representing Velocity, Urgency, or Scale automatically) to add depth to your signals.
  • 3
    Input Data: Populate your radar by clicking any empty space on the grid to add a node instantly, or use the + Manual Add button for more control.
  • 4
    AI Analysis: To activate intelligence features, enter your Gemini API Key in the top navigation bar. (see below instructions)
  • 5
    Connect Nodes: To visualise dependencies or causal relationships (e.g., how one risk triggers another), click on a node to edit it, then select related signals in the "Connect Nodes" list (or use Ctrl+Click if supported). This draws dashed lines between them to reveal systemic patterns.
  • 6
    Save & Load: For saving, click the Floppy Disk icon to download your entire workspace as a lightweight `.json` file. This preserves your nodes, configuration, and analysis state for future sessions to import. To load, please click the Folder icon to open and import a previously saved `.json` file to instantly restore your session.
  • 7
    3D Visualisation: Click the button to see the visualisation, and click to download the standalone interactive radar to your local computer.
  • 8
    Report: Click the Report button to generate a clean, print-ready view (PDF) that combines your visual matrix with the detailed AI strategic insights.

Report Function Note: If the window does not appear, check if your browser has blocked a pop-up. Once the report window opens, right-click anywhere and select "Print", then choose "Save as PDF" as the destination to export the full document.

Z-Axis Integration

Unlocking the Third Dimension

Standard 2D matrices leave out a crucial third factor: Velocity, Urgency, or Scale.

When adding a node, assign a Z-Axis value. Then click the "3D Radar" button to instantly project your entire matrix into a fully interactive 3D spatial environment to discover hidden relationships.

Preview 3D Visualisation
3D Radar Chart Visualisation

Horizon Scanning Masterclass

The complete guide on Strategic Foresight and frameworks used in this tool.

Module 1: The Core Philosophy

Horizon Scanning is not about predicting the future. Instead, it is the systematic detection of early warning signs—often called "weak signals"—to help organizations prepare for multiple possible futures.

"The future is not a destination, but a direction."
  • The Shift: Move from "fire-fighting" (reacting to disruption) to "fire-proofing" (anticipating disruption).
  • The Goal: It is better to be vaguely right than precisely wrong. We scan to identify threats and opportunities before they become obvious to everyone else.
  • Key Concept: Trends start as outliers (the edges of your matrix) before moving to the center (mainstream). Your job is to catch them at the edge.

Module 2: The Anatomy of a Signal

In horizon scanning, every data point is called a signal. Knowing what type of signal you're looking at determines the correct strategic response.

Signal Type Definition Typical Source Strategic Action
Weak Signal Ambiguous, rare, or unexpected fragments of emerging change Fringe media, niche research, anomalous data Scan & Monitor
Emerging Issue A signal gaining traction; direction becoming clearer Academic papers, specialist press, early adopters Analyze & Assess
Trend Measurable direction of change with observable momentum Industry reports, government data, mainstream media Adapt & Align
Megatrend Multi-decade global transformation (e.g., digitalization, climate) UN, World Bank, OECD long-range reports Reframe Strategy
Wild Card Low-probability, extremely high-impact events Tail-risk analysis, black swan literature Contingency Plan

The Signal Lifecycle: How Weak Signals Become Megatrends

Stage 1 — Noise

A single unusual data point appears. Easy to dismiss as an anomaly or coincidence. Most organizations miss this entirely.

Stage 2 — Weak Signal

Pattern recognition kicks in. Similar signals appear across different domains. Only skilled scanners pick this up.

Stage 3 — Emerging Issue

Researchers, journalists, and specialists begin covering the issue. Momentum is building but mainstream awareness is still low.

Stage 4 — Established Trend

Mainstream adoption. Measurable data. Most organizations are now aware — first-mover advantage is gone.

Stage 5 — Megatrend / Paradigm Shift

Structural transformation of society, markets, or governance. Everyone plans around it. The opportunity for disruption has passed.

The Foresight Advantage: Organizations that detect signals at Stage 1–2 have 3–5 years to respond. Those who react at Stage 4 are already behind. This time gap is the strategic value of horizon scanning.

Module 3: STEEP Framework for Horizon Scanning & Foresight Analysis

The STEEP framework is a foundational tool in horizon scanning and strategic foresight, designed to ensure a comprehensive and structured analysis of external trends and emerging signals.

Without a structured framework, foresight practitioners often fall into "tunnel vision"—focusing too heavily on a single domain such as technology. By applying the STEEP framework, you can systematically scan across multiple dimensions and capture a more holistic view of future change.

What Does STEEP Stand For in Foresight?

S - Social Factors

Social trends include demographics, cultural shifts, education patterns, lifestyle changes, and evolving public values that influence long-term societal transformation.

T - Technological Factors

Technological signals include innovation, artificial intelligence, digital transformation, automation, cybersecurity, and emerging R&D breakthroughs.

E - Economic Factors

Economic trends cover market dynamics, global trade, inflation, labor market shifts, financial systems, and macroeconomic disruptions.

E - Environmental Factors

Environmental scanning focuses on climate change, sustainability, natural resources, biodiversity, and regulatory pressures related to the environment.

P - Political Factors

Political factors include government policy, regulation, geopolitical dynamics, elections, and institutional stability that shape strategic environments.

In professional foresight analysis, the STEEP framework is often used alongside horizon scanning tools to categorize weak signals, identify emerging trends, and support evidence-based decision making in both public policy and corporate strategy.

Module 4: The 6 Analytical Matrices

Your application includes 6 built-in templates. Choosing the right one determines the strategic output of your session.

About the Z-Axis (Optional – Advanced Mode)

All matrices primarily operate in two dimensions (X and Y). The Z-Axis is optional and designed for advanced analysis only.

  • For simple mapping, use X and Y only.
  • Leave Z = 0 if additional depth is not required.
  • When Z remains at 0, AI analysis will not apply weighting or evaluation to this third dimension.
  • Activate Z only when urgency, velocity, scale, or systemic escalation meaningfully affects prioritisation.

Clarity first. Depth second.

Here is how to use them effectively:

1. Impact vs. Probability (Risk Matrix)

Purpose: Traditional Risk Management.

  • Top-Right (High/High): Critical Risks. These are dangers that are likely to happen and will hurt. Mitigation plans are mandatory immediately.
  • Top-Left (High Imp/Low Prob): Black Swans. Events that are unlikely but catastrophic. Requires insurance or emergency contingency drills.

2. Impact vs. Uncertainty (Foresight Matrix)

Purpose: Scenario Planning (The most strategic view).

  • Top-Right (High/High): Scenario Candidates. These are critical uncertainties. Because the outcome is unsure but the impact is high, these define your different "Future Scenarios."
  • Top-Left (High Imp/Low Unc): Planning Realities. These are "inevitable futures" (e.g., aging population). Since uncertainty is low, do not plan for them, plan around them.

3. Urgency vs. Importance (Priority Matrix)

Purpose: Action Planning & Eisenhower Matrix.

  • Top-Right: Do First. Tasks that are both urgent and important.
  • Bottom-Right: Schedule. Important but not urgent.
  • Top-Left: Delegate. Urgent but less important strategically.

4. Influence vs. Interest (Stakeholder Mapping)

Purpose: Managing actors in an ecosystem.

  • Top-Right: Key Players. Stakeholders with high power and high interest. Manage closely and engage daily.
  • Bottom-Right: Keep Informed. High interest but low power. They can be allies; keep them updated.

5. Novelty vs. Maturity (Innovation Radar)

Purpose: Technology tracking and R&D portfolio management.

  • Top-Left (High Nov/Low Mat): Bleeding Edge/R&D. High risk, potential high reward. "Moonshot" projects.
  • Bottom-Right: Commodity. Standard technologies that are mature and common. Focus on efficiency here.

6. Time Horizon vs. Impact

Purpose: Roadmap alignment.

X-Axis: Timing How soon will this hit? (Short / Medium / Long Term).
Y-Axis: Magnitude How hard will it hit? Use this to map out when to allocate resources.

Module 5: Avoiding Cognitive Biases in Horizon Scanning & Foresight Analysis

In horizon scanning and strategic foresight, the quality of insight depends not only on data and tools, but also on the analyst’s ability to think critically and objectively.

Cognitive biases are systematic patterns of thinking that can distort how signals are interpreted. If left unchecked, these biases can lead to flawed foresight analysis, missed weak signals, and poor strategic decisions.

Common Cognitive Biases in Foresight and Horizon Scanning

Confirmation Bias

Confirmation bias is the tendency to prioritize information that supports existing beliefs while ignoring contradictory signals. In foresight analysis, this can result in incomplete or misleading trend identification.

How to Avoid: Actively search for at least one counter-signal for every major trend you identify to ensure balanced analysis.

Availability Heuristic

The availability heuristic occurs when analysts overestimate the importance of recent or highly visible events, such as viral news or crises, while overlooking slower but more impactful long-term trends.

How to Avoid: Use structured frameworks like the STEEP framework to ensure you scan across all domains, including less visible but critical slow-moving signals.

Groupthink

Groupthink happens when individuals conform to consensus in group discussions to avoid conflict. This reduces critical thinking and limits the diversity of perspectives in foresight workshops.

How to Avoid: Use analytical tools or visualization features (such as signal mapping or divergence analysis) to highlight differences in interpretation before group discussion.

In professional foresight and horizon scanning practices, recognizing and mitigating cognitive biases is essential for generating reliable insights, identifying weak signals accurately, and supporting better long-term decision making.

Module 6: Weak Signals vs Trends vs Megatrends in Foresight & Horizon Scanning

One of the most critical skills in horizon scanning and strategic foresight is the ability to distinguish between weak signals, trends, and megatrends.

Misinterpreting these categories can lead to flawed analysis—either overreacting to noise or underestimating major long-term shifts. Understanding the difference allows foresight practitioners to prioritize signals correctly and build more resilient strategies.

Definitions: Weak Signals, Trends, and Megatrends

Weak Signals

Weak signals are early, fragmented indicators of change that may seem insignificant or unclear today, but have the potential to evolve into major trends in the future. They are often hidden in niche communities, emerging technologies, or unexpected behaviors.

Trends

Trends are patterns of change that are already visible and measurable. They represent a direction of movement over time and are supported by data, adoption, and observable momentum across industries or societies.

Megatrends

Megatrends are large-scale, long-term transformations that shape the global landscape over decades. Examples include climate change, digitalization, and demographic shifts.

Key Differences in Foresight Analysis

Category Visibility Time Horizon Strategic Value
Weak Signals Low (emerging, uncertain) Early-stage future High potential, high uncertainty
Trends Medium (observable) Short to mid-term Actionable and measurable
Megatrends High (widely recognized) Long-term (10+ years) Structural and transformative

In strategic foresight, the real advantage lies in detecting weak signals early—before they evolve into trends or megatrends. Organizations that master this capability can anticipate disruption, innovate faster, and gain a long-term competitive edge.

Effective horizon scanning tools should help analysts capture weak signals, track emerging trends, and connect them to broader megatrends—transforming scattered data into actionable foresight insights.

💡 Creative Use Case: Applying Foresight to “Crush Mapping”

Who says horizon scanning and strategic foresight are only for governments, NGOs, or corporate risk analysis?

You can apply the exact same framework to something far more unpredictable: your gebetan (crush). Welcome to data-driven romance. 📊❤️

👉 1. Set Up Your Foresight Canvas

Use an Influence vs. Interest matrix. Define your axes:

  • X-axis (Interest): How much effort they invest in you
  • Y-axis (Influence): How much they affect your emotions and daily mood
👉 2. Map the Signals (The Quadrants of Love)

Treat every interaction as a weak signal in your personal horizon scanning process:

  • 🔴 Top-Right (High Interest, High Influence – “Soulmate Zone”):
    “They initiated a deep conversation at 2 AM.”
    Strategy: Key player. Engage actively—this is a strong signal.
  • 🟡 Top-Left (Low Interest, High Influence – “Overthinking Zone”):
    “Left you on read for 12 hours.”
    Strategy: High emotional impact, low commitment. Protect your sanity.
  • 🔵 Bottom-Right (High Interest, Low Influence – “Friendzone Ally”):
    “Replies instantly, but zero romantic tension.”
    Strategy: Stable, supportive—but don’t misinterpret the trend.
  • 🟢 Bottom-Left (Low Interest, Low Influence – “Noise Zone”):
    “Liked your Instagram story from 2021 at 3 AM.”
    Strategy: Weak signal. Monitor—do not overreact.
👉 3. Analyze the System (Causality Mapping)

Connect signals like a foresight analyst. For example: link “2 AM conversation”“Probability of a date”. This helps you move from random events to structured insight.

👉 4. Run the Analysis

Let your system (or AI) evaluate the pattern objectively. Are you seeing a genuine emerging trend… or just a series of misleading weak signals?

Behind the humor lies a serious insight: foresight is about interpreting uncertainty. Whether you're mapping global risks or human emotions, the challenge remains the same— distinguishing real signals from noise.

Frequently Asked Questions

Common questions about horizon scanning and strategic foresight.

What is the difference between horizon scanning and strategic foresight?

Horizon scanning is the input process — the systematic gathering and monitoring of signals across multiple domains. Strategic foresight is the broader discipline that includes horizon scanning, plus scenario planning, causal analysis, backcasting, and the translation of insights into strategic decisions. Think of horizon scanning as the radar, and strategic foresight as the entire navigation system.

How is horizon scanning different from traditional market research?

Market research focuses on present customer behavior and near-term market conditions. Horizon scanning deliberately looks further out — 5, 10, 20 years — at signals that have not yet become mainstream. It is explicitly designed to surface discontinuities: moments when the future diverges fundamentally from past trends. Market research tells you what is; horizon scanning explores what could be.

Who uses horizon scanning in practice?

Horizon scanning is used by national governments (Singapore, UK, Finland, UAE), international organizations (OECD, UN, EU Commission), corporations (Shell, McKinsey, Deloitte), military and intelligence agencies, central banks, public health agencies (WHO), and increasingly by NGOs, universities, and city governments. It is a core competency in any organization dealing with long-range planning under uncertainty.

How long does a horizon scanning exercise take?

A focused single-day workshop can produce useful results, but a rigorous scan typically takes 2–8 weeks: 1–2 weeks of distributed signal gathering, a 1–2 day synthesis workshop, and 1–2 weeks to write up findings and scenario narratives. Ongoing monitoring programs run continuously. The Singapore Centre for Strategic Futures, for example, runs continuous scanning with periodic deep-dive synthesis reports every 6 months.

What is a "weak signal" in foresight, and how do you find one?

A weak signal is an early, ambiguous indicator of possible change — often found in fringe academic journals, niche online communities, patent filings, startup activity, regulatory edge cases, or surprising behavior in small groups. To find them: read widely outside your domain, monitor cross-domain databases (e.g., arXiv, patent offices, startup funding data), follow unconventional thinkers, and pay attention to things that seem "weird" or "don't fit" your current mental model — those are often the most valuable signals.

Can AI tools replace human foresight analysts?

Not entirely — but AI significantly augments foresight work. AI excels at signal volume processing, pattern detection across large datasets, cross-domain synthesis, and first-pass scenario drafting. However, interpretation, normative judgment, systems thinking, and stakeholder communication still require human expertise. The most effective foresight practices combine AI-powered scanning tools with experienced human analysts who bring contextual judgment, domain knowledge, and ethical reasoning that AI cannot replicate.

Setting Up Google Gemini AI

To unlock AI Analysis, you need a free API key from Google.

  1. Visit Google AI Studio and Login.
  2. Click the blue "Get API key" button.
  3. Click "Create API key".
  4. Copy the generated key (starts with AIza...).
  5. Paste your key into the Top Navbar of the Horizon Scan application.

Privacy Guarantee

Your API Key is stored locally in your browser (Local Storage). It is never sent to our servers, as this application runs 100% Client-Side. Do not share your API key publicly.

Offline Accessibility

You can run this application without an active internet connection:

  • Save for Offline: Use your browser's "Save Page As..." and select "Webpage, Complete".
  • Usage: Input data, save, and load JSON projects locally.
  • Note: AI Analysis and PDF Reporting require you to go back online to function.

Deepen Your Strategic Foresight

Explore our collection of in-depth articles, case studies, and advanced frameworks on anticipatory governance and cognitive biases.

Enter Articles Hub

Radar Defender

Take a break! Destroy the "Threat Signals" before they breach the perimeter.
Desktop: Use Arrow Keys (A/D) to move, Spacebar to shoot. | Touch: Tap to shoot, Drag to move.

SYSTEM STANDBY

Initiate defensive protocol?