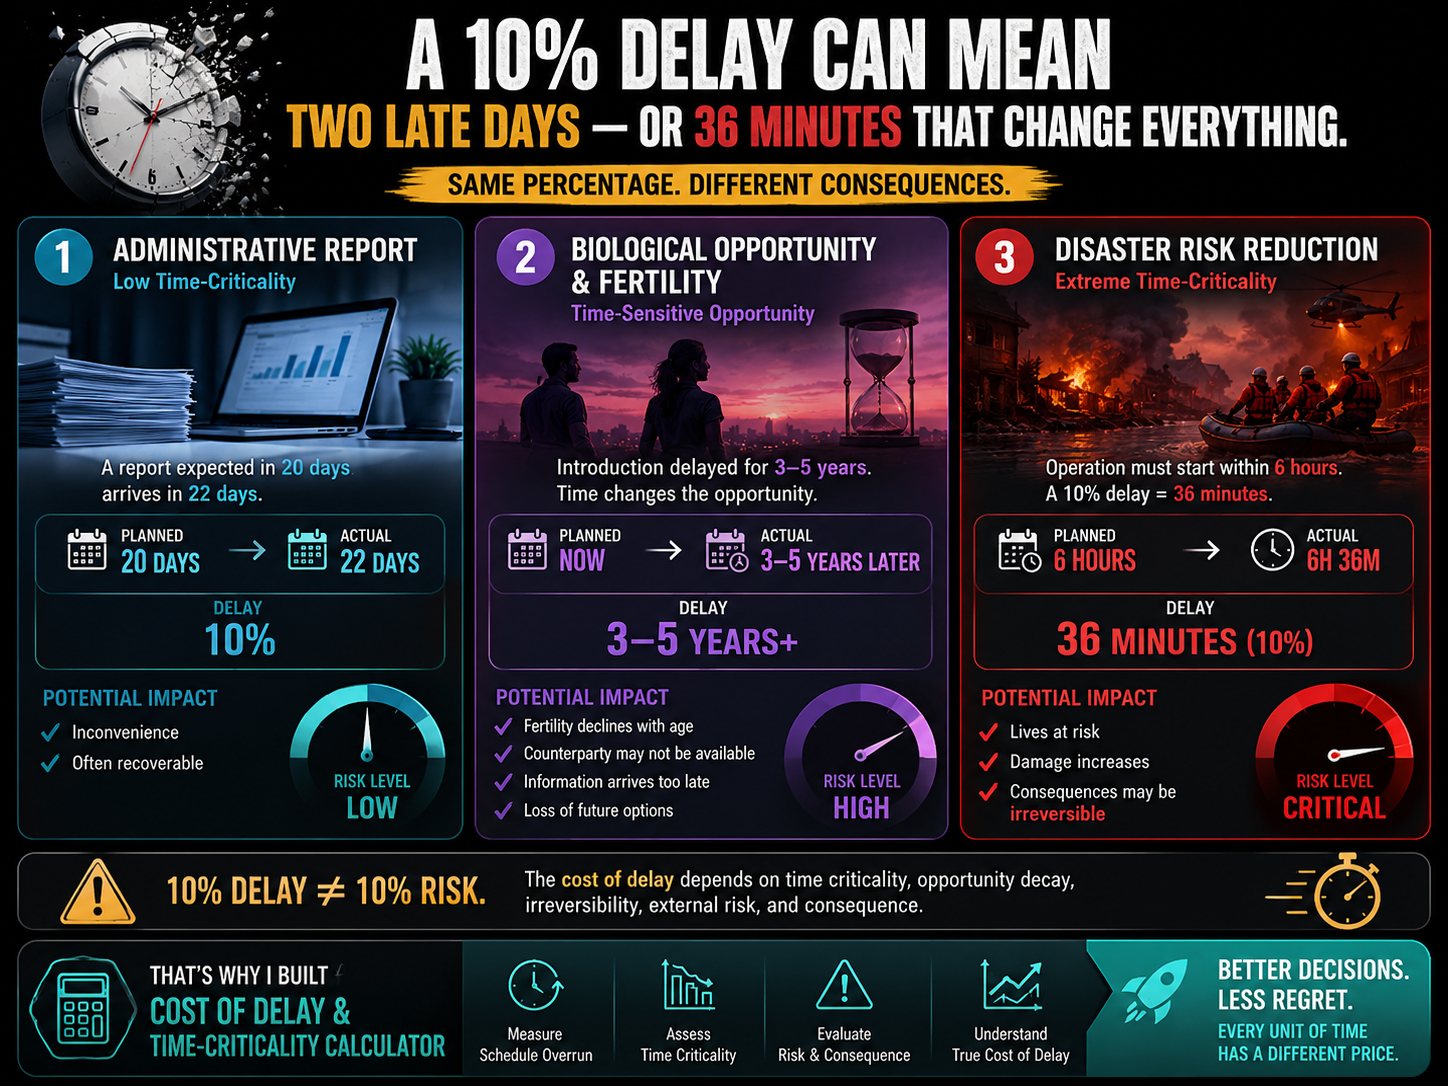
There is a myth in project management that time is money. The truth is more brutal than that: time is a decaying asset, and the moment you miss a deadline, that asset does not depreciate in a straight line — it often falls off a cliff.
I started thinking seriously about this after watching two very different failures. One was a startup that delayed a product launch by two weeks to "polish the UI," only to watch a competitor capture the market first. The other was a disaster relief coordination team that delayed a supply drop by three days because of an approval bottleneck — and the value of that delay was measured in a currency far heavier than money.
Both cases share the same underlying structure. Both are victims of what economists and agile practitioners call the Cost of Delay (CoD) — the quantifiable financial and strategic loss incurred for every unit of time a decision, project, or intervention is postponed.
Why "Being Late" Is Not a Single Kind of Problem
Most people intuitively understand that being late is bad. Few people understand that how a thing decays in value is just as important as how long it is delayed.
Consider four completely different scenarios:
- A quarterly compliance report filed four days late. Annoying, but essentially harmless. Value decays almost linearly, if at all.
- A product launch delayed by two weeks in a fast-moving market. Every week that passes, a competitor edges closer, and the total addressable market shrinks. Decay is exponential.
- An M&A negotiation where the counterparty has other options. The longer you wait, the more likely they walk away — not gradually, but through a psychological and contractual threshold.
- A disaster response window — the so-called "Golden Hour" in emergency medicine, or the 72-hour survival window in earthquake response. Value does not decay slowly here. It collapses instantly once a threshold is crossed. This is a Hard Cliff.
Traditional project management tools — Gantt charts, burn-down charts, simple variance analysis — capture that something is late. They almost never capture how much that lateness actually costs, nor do they distinguish between a linear administrative delay and a catastrophic, irreversible one.
Borrowing from Agile, Risk Management, and Real Options Theory
The framework I want to walk through here draws on three distinct disciplines that rarely get combined into a single practical tool:
1. WSJF (Weighted Shortest Job First) — a prioritization technique from the Scaled Agile Framework (SAFe) that ranks work based on Cost of Delay divided by job duration. It forces teams to ask not "what is urgent" but "what is expensive to postpone."
2. ISO 31000 Risk Analysis — which teaches us to separate likelihood from consequence, and crucially, to evaluate risk severity through multiple lenses: how reversible is the damage, how volatile is the environment, and how fast does the exposure window close.
3. Real Options Theory — borrowed from financial economics, where the right (but not obligation) to act at a future date has a quantifiable value that decays as the option nears expiration or as uncertainty resolves against you. A market opportunity, much like a call option, has a "time value" that bleeds away the longer you hesitate.
When you combine these three lenses, you stop asking simply "are we late?" and start asking a much sharper question: "Given how this specific type of value decays, how much money — and how much strategic option value — are we burning per day of delay, and is it economically rational to pay extra to accelerate?"
The Two Components of Cost of Delay
Most naive CoD calculations only look at one number: potential revenue lost. That is incomplete. In reality, cost of delay is made of two very different components that must be added together:
Component 1 — Direct Overhead Loss. This is the boring, linear part: every extra day of the project consumes salaries, rent, utilities, opportunity cost of the team's time. It is simply Days Delayed × Daily Burn Rate. Predictable, unavoidable, and often underestimated because it hides inside "we'll just work a bit longer."
Component 2 — Value Decay Loss. This is the interesting, non-linear part. The target value at stake (a contract, a market opportunity, a life to be saved, a negotiation) does not remain constant while you're late. It erodes — and the shape of that erosion curve depends entirely on the nature of the opportunity.
Note
The interactive tool below implements exactly this two-component model, using a criticality multiplier (λ) derived from three qualitative risk dimensions: Decay Speed, Irreversibility, and Counterparty Risk. It also includes a Crashing ROI module — telling you whether it is economically rational to pay extra money to accelerate a late project.
How to use the Cost of Delay Simulator
- Enter your planned vs. actual/estimated duration, the value at stake, and your daily burn rate (Panel 1).
- Select how fast value decays, how reversible the loss is, and how volatile your counterparty/environment is (Panel 2).
- Optionally simulate a "crashing" scenario — paying extra to cut delay days — and see whether it's economically rational (Panel 3).
- Review the Risk Score gauge, decay curve, total Cost of Delay, and the Crashing ROI verdict in the results panel.
- Tap the Quick Load presets to see how radically the decay shape changes the financial outcome.
Fig. 1 — Enterprise Cost of Delay & Time-Criticality Simulator. All calculations run locally in your browser; nothing is transmitted or stored.
Enterprise Cost of Delay Simulator
Quantify financial loss, strategic option erosion, and whether paying to accelerate is worth it.
Total business value intended to be captured at T₀.
Salaries, team, and fixed overhead consumed per day of delay.
Test whether adding resources to recover the schedule pays for itself.
Total Cost of Delay
$0
Loss + Overhead
Time Overrun
0%
0 days behind
Criticality λ
1.00x
Combined sensitivity
Vertical axis = cumulative value lost. Dashed line = target T₀.
Crashing ROI Verdict
Calculating…
Feasibility of the additional acceleration cost versus the loss it avoids.
Status
Formula
CoD = (ΔDays × BurnRate) + V₀ × [1 − (1 − r)^ΔDays] where r = 0.02λ
- λ = Decay × Irreversibility × Counterparty ÷ 2
- Hard Cliff: value collapses to zero past the tolerance threshold
- Crashing ROI = (Avoided Cost − Acceleration Cost) ÷ Acceleration Cost
Try switching between the four Quick Load presets inside the simulator above. Notice how an identical percentage of "lateness" — say, a 50% time overrun — produces wildly different financial consequences depending on whether the decay curve is linear, exponential, or a hard cliff. That difference is the entire point of this framework: delay is not a single number, it is a shape.
Reading the Risk Score and the Decay Curve
The simulator compresses three qualitative judgments — Decay Speed, Irreversibility, and Counterparty Risk — into a single Criticality Multiplier (λ). This is deliberately simple by design: in real enterprise risk workshops, teams rarely have the patience for a twenty-variable regression model. What they need is a fast, defensible way to separate "this delay is annoying" from "this delay is existential."
The Risk Score gauge translates λ and your overrun percentage into a single 0–400+ scale. A score under 30 usually means you're looking at friction, not failure. A score above 200 typically signals that a large share of your original opportunity value is already gone — and no amount of hustling later will bring it back if the underlying decay is exponential or cliff-shaped.
The shaded decay curve is arguably the most important visual in the tool. It answers a question no spreadsheet variance report can answer: at what point does further delay stop being marginally costly and start being catastrophically costly? For Hard Cliff scenarios (disaster response, expiring legal windows, biological deadlines), that point is sharp and visible as a near-vertical jump. For exponential decay (competitive markets, negotiation leverage), the curve bends steadily and never fully plateaus — meaning the incentive to accelerate never really disappears.
When Should You Actually Pay to Go Faster?
This is where the Crashing ROI module becomes the most practically useful part of the whole exercise. "Crashing" a schedule — a formal project management term — means injecting extra resources (overtime, additional staff, expedited shipping, premium vendors) to shorten the timeline, at an additional direct cost.
The naive intuition is: "if we're late, spend money to catch up." But that intuition frequently leads to wasted spending. The simulator forces a more disciplined comparison:
- Calculate the Cost of Delay if nothing changes (baseline CoD).
- Calculate the Cost of Delay after the proposed acceleration (crashed CoD).
- The difference between these two is the Avoided Cost — what you actually save by paying to go faster.
- Subtract the price of acceleration itself. What remains is the Net Savings, and this is the only number that should drive the decision.
If Net Savings is negative, spending money to accelerate is economically irrational — no matter how uncomfortable the delay feels emotionally. Conversely, in Hard Cliff and rapid-decay scenarios, even an expensive acceleration budget is frequently justified, because the alternative is losing nearly all the value at stake.
A Framework, Not a Verdict
It is worth being honest about the limitations of this tool. The multiplier λ is a structured simplification of judgment calls that, in the real world, deserve a room full of stakeholders debating them — a legal team's view of counterparty risk will differ from a sales team's view of the same clock. The exponential decay approximation is a modeling choice, not a law of physics; real markets sometimes decay in bursts tied to specific external triggers (a competitor's announcement, a regulatory deadline) rather than smoothly over time.
What this framework does provide is a shared vocabulary and a fast, transparent starting point for a conversation that too often happens purely on gut feeling. It turns "we're a bit behind schedule, but it should be fine" into an explicit, falsifiable, revisitable number — one that a CFO, a project manager, and a field operations lead can all interrogate using the same formula.
Cost of Delay is not about punishing lateness. It is about making the invisible price of waiting visible enough that an organization can make a conscious, economically grounded choice — accelerate, absorb the loss, or walk away — instead of drifting into the cliff by default.
#CostOfDelay #WSJF #RealOptionsTheory #ISO31000 #ProjectManagement #RiskAnalysis #CrashingCost #DecisionScience #AgilePrioritization #OpportunityCost
Conceptual Note
This tool synthesizes three established frameworks: Weighted Shortest Job First (WSJF) from the Scaled Agile Framework, risk severity principles from ISO 31000, and the time-decay-of-option-value concept from Real Options Theory in financial economics. It is intended as a structured decision-support instrument for prioritization conversations, not as a certified financial or actuarial model.
All monetary outputs depend entirely on the accuracy of the inputs supplied by the user — value at stake, burn rate, and the qualitative risk selections. For high-stakes decisions (capital allocation, disaster response resourcing, legal negotiations), this simulator should support, not replace, expert judgment and formal risk assessment processes.